What Is Precision and Recall in Machine Learning?

What Is Precision and Recall in Machine Learning?
Nowadays, there are many different models for machine learning, and the accuracy values of these models differ according to the applied problem. While choosing the model with the highest accuracy may seem appropriate at first glance, you may get different effects from different types of errors in your study. For this reason, you are choosing the most suitable model for your work instead of the most accurate model that will allow you to achieve much better results.
Is accuracy enough to select a model?
What does the accuracy represent in a machine learning model, and how is it calculated?
Accuracy is the ratio of the predictions made correctly in the model to predictions. For example, let's have an album containing 50 male and 50 female photos and set up a classification model to determine the gender of the people in this album. Suppose our model successfully classifies 50 women and 49men. In contrast, our model categorizes a photo of a man as a woman and makes a mistake. In this case, we have 100 predictions, 99 correct and one incorrect. According to the definition of accuracy we have mentioned above, the value we get is 99%.
Let me examine another example. In this instance, let's say we have a dataset of 100 patients with and without cancer. According to real findings, 2 out of 100 patients have cancer (This example is quite unstable compared to the first example). The model established for this example affixed the label non-cancerous to one of the two cancer patients along with the other 98non-cancerous patients and correctly predicted one of the patients with cancer. In the light of this information, We have 100 predictions, and 99 of them are correct. As a result, the accuracy value of the model is 99% for this example as well.
The results look great for both situations, don't they? Let's examine it a little more.
In our first example, let's assume that our related item is the detection of male photos, and our model predicts 98% of the relevant items in this case. For the second example, let's define our related item as the detection of cancer patients. Here's where things get interesting. Although both of our examples had an accuracy of 99%, only 50% of the relevant items were predicted correctly in this example. But how can we utilize this data to select the best model?
Model accuracy alone is not sufficient, especially in unbiased data sets. Therefore, we need other evaluation criteria to evaluate the model. But first, let's examine the following confusion matrix.
WHAT IS A CONFUSION MATRIX?
Confusion Matrix is a visual representation of predicted vs. actual values. It helps measure the performance of our model and resembles a table-like structure,which is beneficial when performing precision and recall calculations.
A Confusion Matrix of the 2-class problem looks like this:

Then, let's classify the predictions made by the model as follows.
True positive (TP): Observation is predicted positive, and the actual situation is positive.
False positive (FP): Observation is predicted positive, and the real situation is negative.
True negative (TN): Observation is predicted negative, and the real situation is negative.
False negative (FN): Observation is predicted negative, and the real situation is positive.
If we apply the confusion matrix and classification situations mentioned above to our second example, we get the following information.

True positive (TP): The model predicts the cancer patient as a cancer patient. (1)
False positive (FP): The model predicts a healthy person as a cancer patient. (0)
True negative (TN): The model predicts a healthy person as healthy. (98)
False negative (FN): The model predicts cancer patients as healthy. (1)
We expect a good model to label positive situations as positive and negative situations as negative. For this reason, we apply two more metrics in addition to accuracy to evaluate the model's success.
Now that we have introduced the confusion matrix, we can discuss the classification model success criteria such as precision, recall, and F-Measure.
WHAT IS PRECISION?
Precision: A classification model's capacity to isolate just the pertinent data elements. In mathematics, precision is calculated by dividing the total number of true positives by the total number of true positives + false positives. (What percent of positive predictions were correct?)
Precision can be calculated as:

In our first example, our model correctly guessed 49 out of 50 male photos and mistakenly tagged the remaining photo as female. In addition, it correctly tagged 50 of the 50 female photos as female, and any female photos have not been tagged as male photos. Thanks to this information, our true positive is determined as 49, and our false positive is determined as 0. According to the above formula, our precision value is calculated as %100.
In our second example, our model labeled one of the two cancer patients as cancer and the other as not cancer and did not label someone who does not have cancer. In addition, it correctly labeled 98 non-cancer people as non-cancer. For this reason, our true positive is determined as one, and our false positive is determined as 0. According to the above formula, our precision value is calculated as %100.
RECALL
Recall is a model's capacity to locate every pertinent example in a data set. Calculating recall mathematically involves dividing the quantity of true positives by the total of true positives and false negatives. (What percent of the positive cases did you catch?)
Recall can be calculated as:

In our first example, our model correctly guessed 49 out of 50 male photos and mistakenly tagged the remaining photo as female. In addition, it correctly tagged 50 of the 50 female photos as female, and any female photos have not been tagged as male photos. Thanks to this information, our true positive is determined as 49, and our false negative is determined as 1. According to the above formula, our precision value is calculated as %98.
In our second example, our model labeled one of the two cancer patients as cancer and the other as not cancer and did not label someone who does not have cancer. In addition, it correctly labeled 98non-cancer people as non-cancer. For this reason, our true positive is determined as one, and the false negative is determined as 1. According to the above formula, our recall value is calculated as %50.
Since our first example had a balanced data set, accuracy, precision, and recall values were very close. All three values indicate that the model is adequate.
For the second example (which has a quite unstable data set than the first), while accuracy and precision suggest that the model is suitable for detecting cancer, the recall calculation reveals the model's inadequacy.
COMBINING PRECISION AND RECALL: THE F-MEASURE
In some cases, we want to maximize recall or precision at the expense of other measurements. For example, in cases of disease detection, we probably want are call close to 1,0. We would like to find all patients who have the disease, so we can accept a low precision. However, when designing a classification model, we want to maximize the F1 score in order to get the best possible recall and accuracy ratio.
The F1 score is the harmonic mean of accuracy and recall using the following formula, which takes into account both me

trics:
Since it penalizes extreme numbers, we prefer to employ the harmonic mean over a simple average. With a simple average of 0.5 but an F1 score of 0, a classifier with a precision of 1.0 and a recall of 0.0 has these metrics.
In our first example, our precision value is 100%, and our recall value is 98%. According to the above harmonic mean formula, our F-1 score is calculated as 0,99.
Coming to our second example, our precision value is 100%, and our recall value is 50%. Thanks to this information, our F-1 score is calculated as 0.67.
For multi-class situations, Precision and Recall can also be used. The output of a 3-class model can be represented as a confusion matrix.

We can calculate the accuracy of the model as follows:

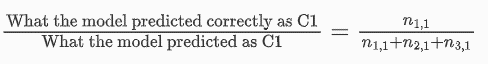
Precision and recall values are calculated separately for each class. Let's look at the calculation of C1 as an example.
The precision of the model for C1:
Recall the model for C1:

Precision and recall values are calculated in the same way for Class 2 and Class 3. In cases where the number of classes is more than 3, calculations are made with the same method.
CONCLUSION
Although accuracy is an essential criterion for evaluating a model, it is insufficient. In addition to accuracy, we should also use the confusion matrix-enhanced precision and recall metrics to evaluate our model. In this way, we can measure how accurate our model is with accuracy, how accurately our positive predictions are with precision, and how accurately we predict positive situations with recall.
Choosing the right model may not be easy, but don't worry. Cameralyze's experienced artificial intelligence and machine learning professionals aim to provide the best service by using the right models for you and your company in our products.
Contact us immediately to learn more and get a start free now, or get in touch with our team.
.png)